Knowledge Map
Knowledge
maps can be understood as graphic indexes of existing individual and
organizational knowledge bases. It includes knowledge
rather than information, and that knowledge is accessed rather than searched
for.
Knowledge maps are extremely intuitive, and they provide great platforms to showcase knowledge assets. Members of the team can navigate the different branches of the map, leading them to groups of assets and new maps. And most assets can be reached following different paths, as different people follow different thought processes. (Heredero, 2016)
Knowledge maps provide an overview of the practical knowledge of how to manage, organize, consolidate, govern, prepare, analyze, and derive value from data. There are various ways to visually represent suxh overview.
The visual representation of Data Literacy Skills and Competencies defined in literature.
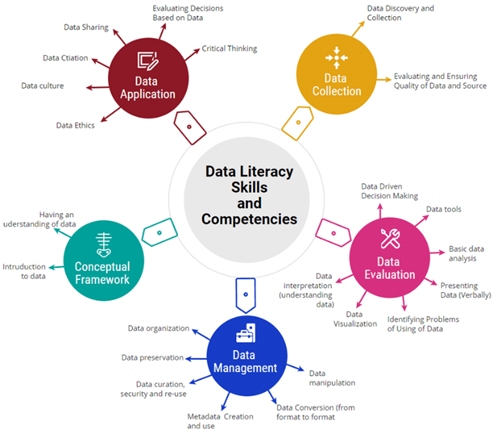
(Guler, 2019)
For futher information DaLiCo Dimension:https://www2.bui.haw-hamburg.de/tematres/vocab/index.php?tema=1967&/dalico-dimensions
Sources:
Guler, G. 2019. Data literacy from theory to reality: How does it look? VUB. https://www.researchgate.net/publication/335620777_Data_literacy_from_theory_to_reality_How_does_it_look